Analytics section helps to analyze the campaign performance.
Using it you can review specific metrics, filter analytic results according to the fixed period and examine impressions and sharing trends.
Additionally, it shows the number of unique visitors who opened the website with the widget and how many of them successfully submitted their predictions.
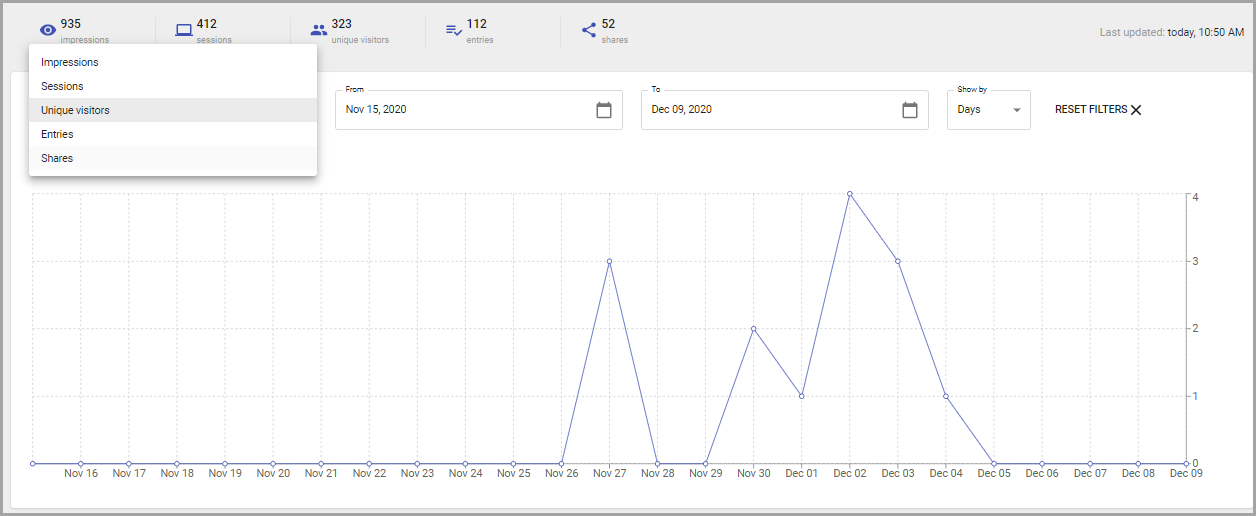
The statistics is available on several metrics.
Those metrics summary displays for the whole period from the campaign publishing up to the time the statistics viewed.
If campaign entries closed:
- Entries will not be collected, thus will not be tracked;
- The statistics on campaign impressions, sessions, unique visitors, and shares will still be tracked.
The metrics are:
- Impressions are counted every time user opens a page with a widget.
- Sessions start when a user visits the page and end after 30 minutes of inactivity.
- Unique visitors — the number of unique page visitors.
- Entries — the number of successfully submitted predictions.
- Shares — are triggered when the user initiates a sharing (clicks on a sharing button for a specific sharing method).
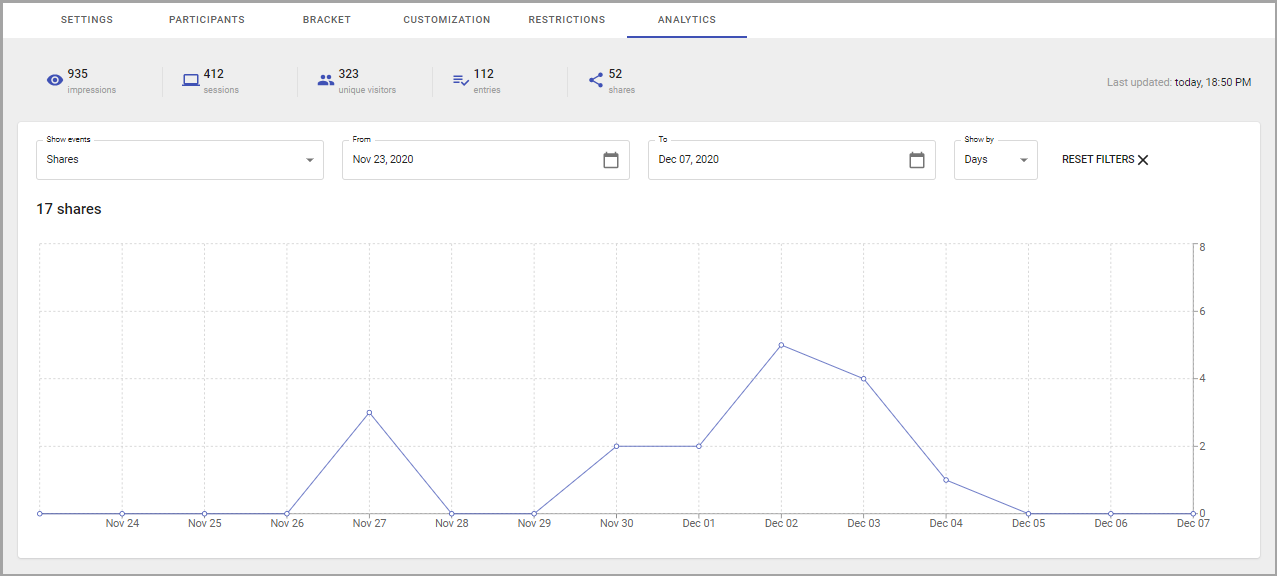
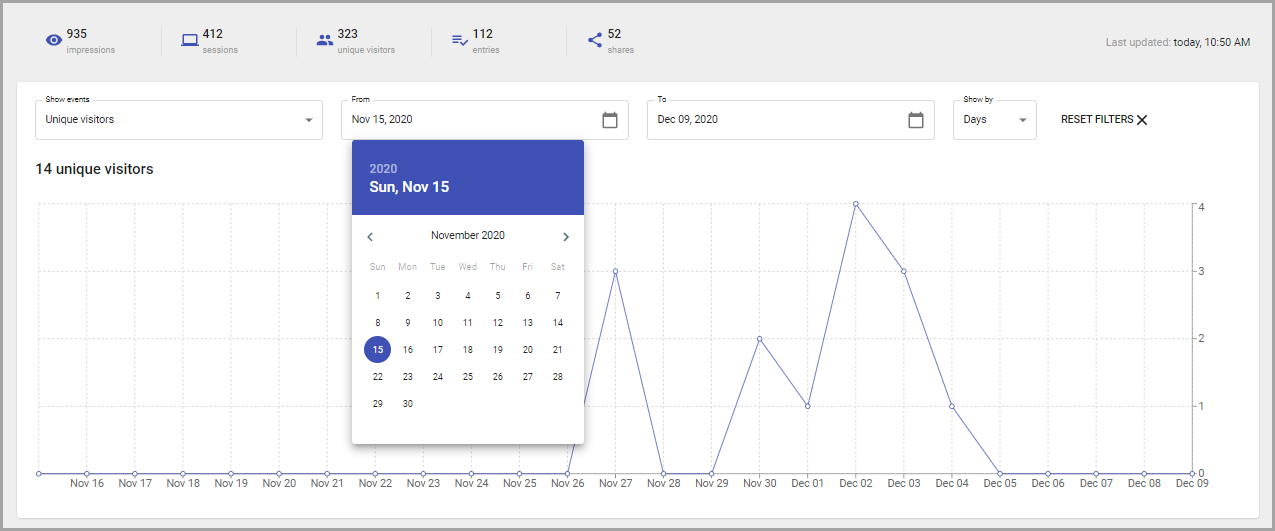
Statistics also limited by the period of time or dates. This information is given in the graph.
To see the graph with the information on specific metrics for some period of time, do the following:
- Select events type from the Show Events list.
- Add start date in the From field.
- Specify the end date in the To field.
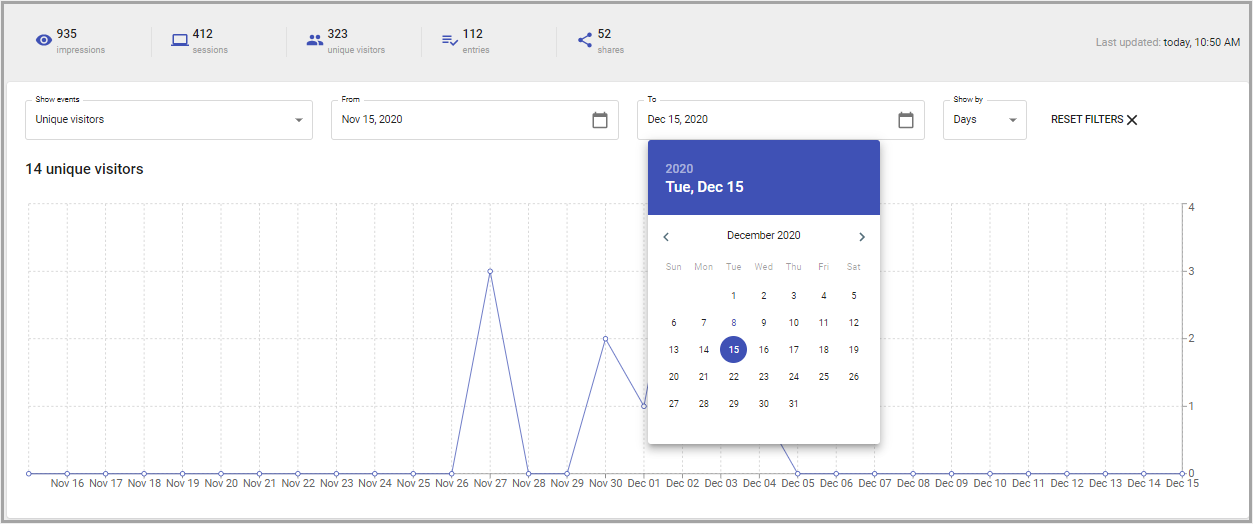
Change Show by parameter to zoom-in/out and see the data with different granularity.
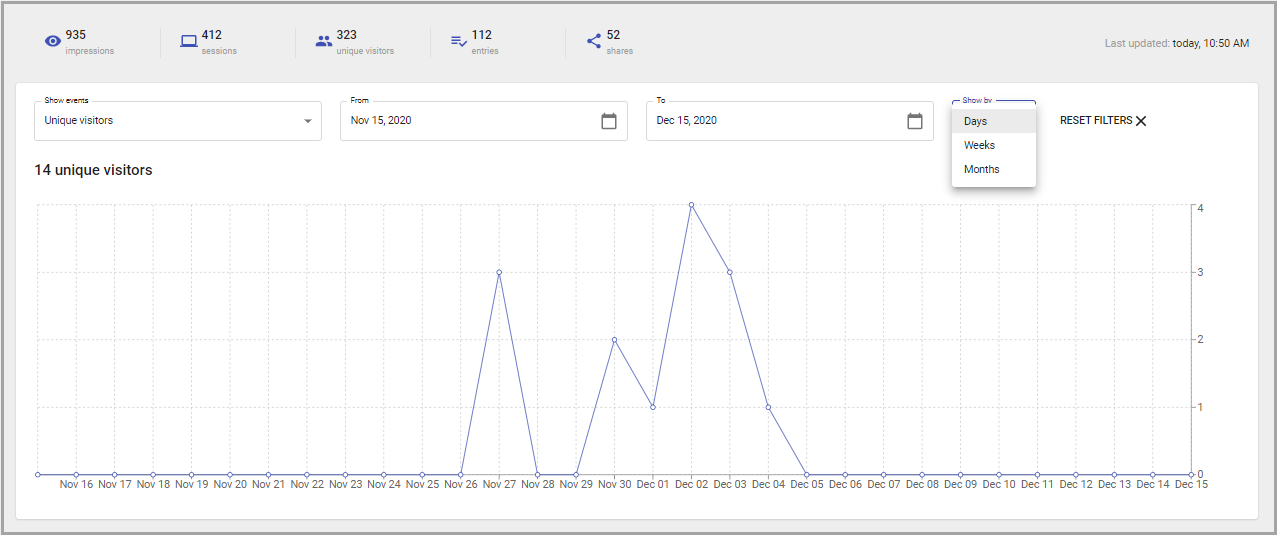
The graph will change according to the added metrics.
To get back to the default filtering settings, click on the Reset Filters option.
The information updates regularly, with a day delay. It means that when opening the page on the current day you will see yesterday's information.
Note: Different metrics for different reports or within the same report are updated asynchronously. Data processing and aggregation take up to 24hrs. Results report update takes up to 1h.