Poll Analytics collects data about the widget and votes results.
Analytics contains two reports:
- Activity report - the information about the widget views, sessions, unique visitors, charges, and entries.
- Results report - the information about poll results.
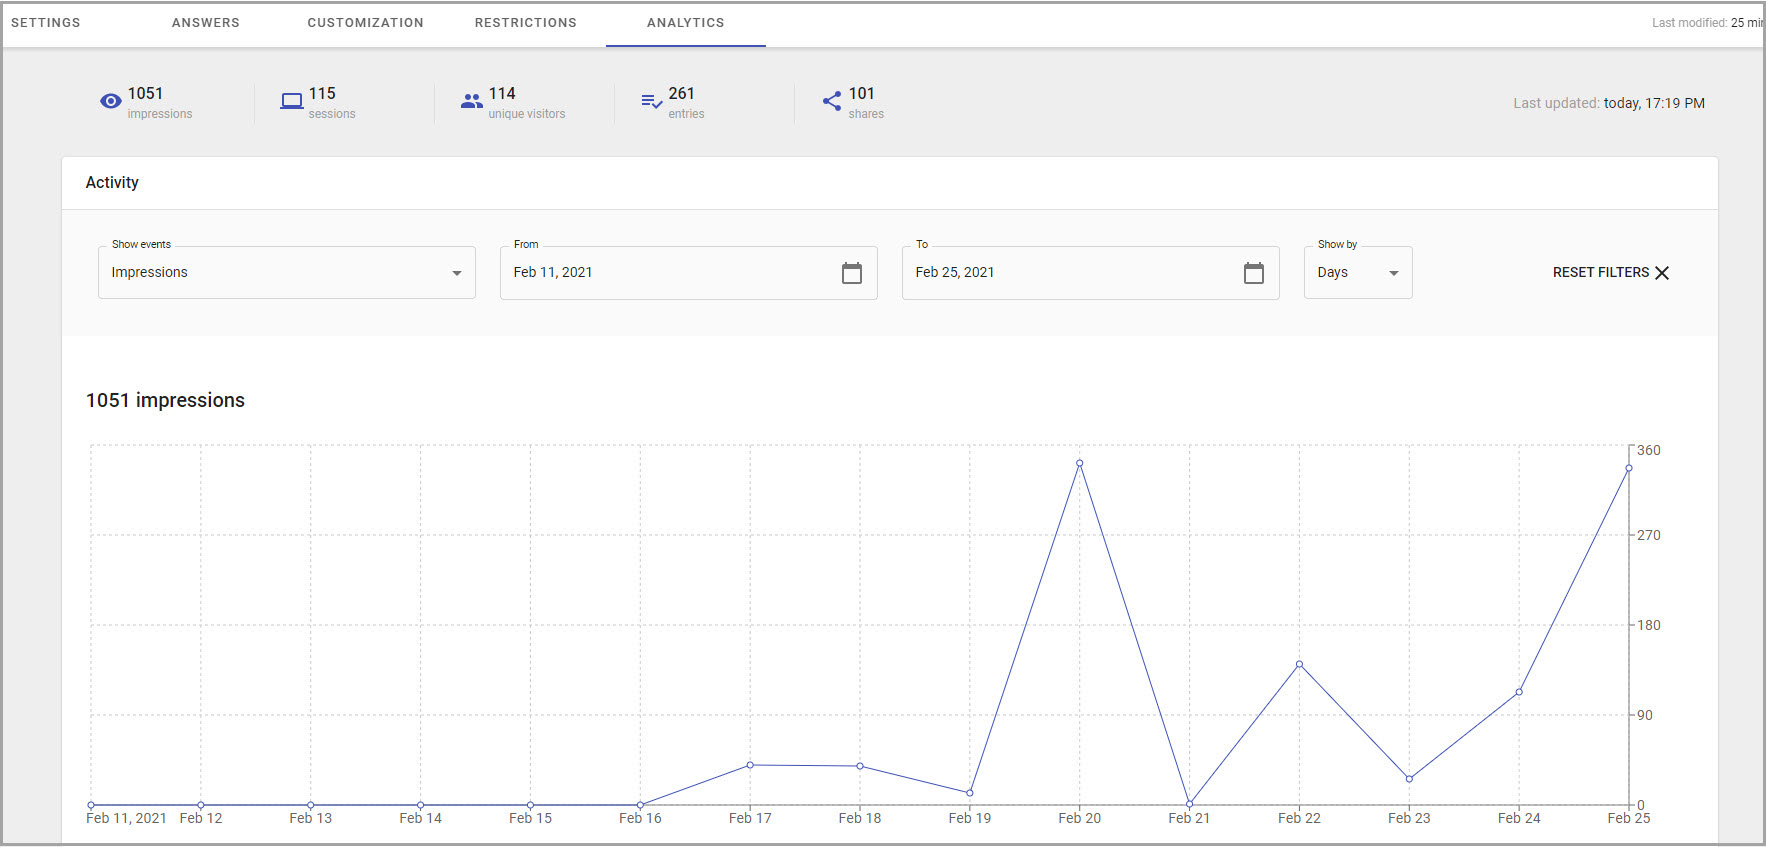
Activity
Activity displays the visual graph of statistics on:
- Impressions - the general amount of widget views.
- Sessions - the number of sessions.
- Unique visitors - the number of unique visitors.
- Shares - the number of share actions (when the user initiated sharing in the social networks)
- Entries - the number of collected entries.
They can be filtered by predefined period and shown by days, weeks, or months.
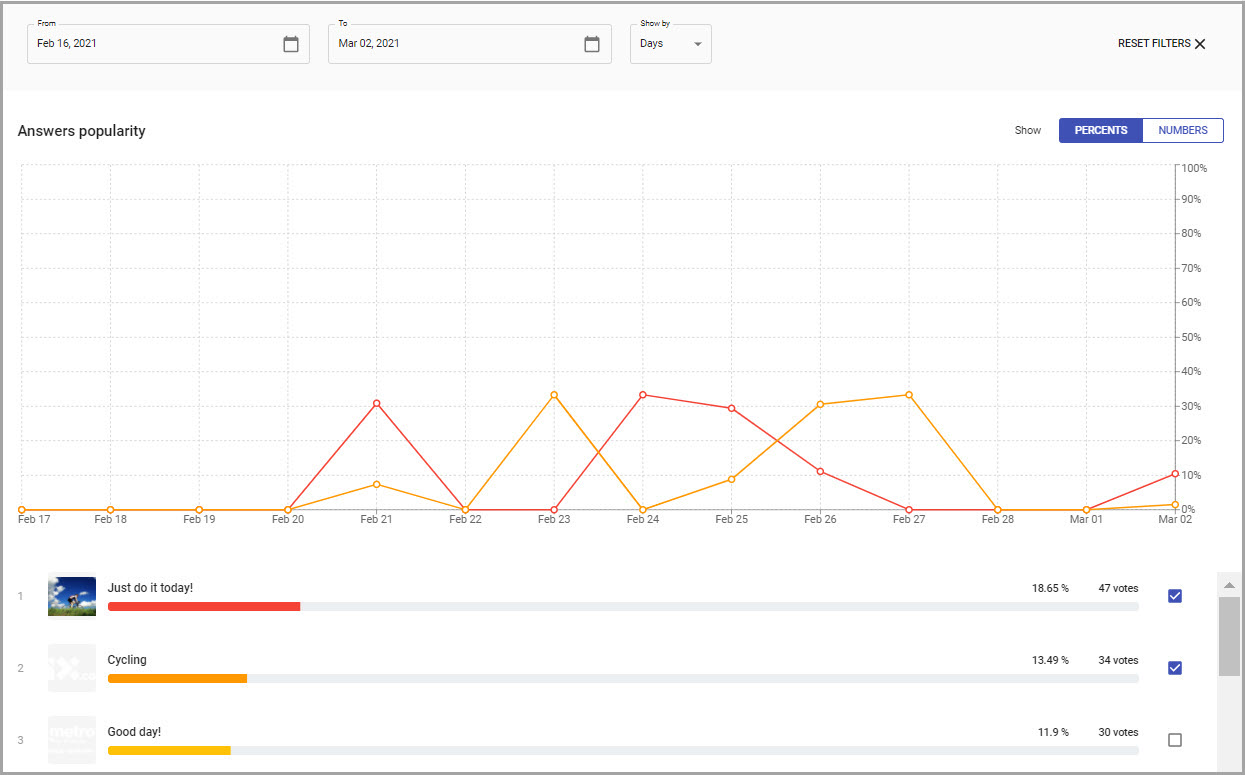
Results
The Results report contains statistics on votes for each answer option.
It also includes an answers popularity graph, that shows how the number of votes changes with time.
The Results report can be filtered by period and shown by hours, days, or weeks.
The answers' popularity statistics can be represented in numbers or percents and can show graphs for multiple answers simultaneously.
The analytics graph can contain answers on one or several options.
Note: Different metrics for different reports or within the same report are updated asynchronously. Data processing and aggregation take up to 24hrs. Results report update takes up to 1h.